Module configuration parameters
(this module has no configurable parameters)Introduction
The SOP shell enables you to test some important features of your SOP. It enables you to do some minimal configuration, only to restore connexion to the SMP, where the configuration of the SOP should normally be done.Opening a Shell
You can use this application by:- connecting a screen and a keyboard directly to the server
- using SSH, on windows for example you can use the Putty client.
- ESC: reset the cursor to the first menu item (System)
- Navigate via mouse or keybord arrows
Credentials:
- Three user levels are available:
- "admin" (all shell functionalities)
- "customer" (restricted functionalities)
- "recovery" (allows to reset the admin password)
- The default password is the same name as the login for the "admin" and "customer" user levels but they can be changed via the module "local admin password" (to be installed via the SMP web interface, higly recommended)
- For the recovery user level, the password is uniquely generated and is accessible on the SMP in the "Advanced->Server Configuration" page for smpadmin users.
Menus for admin user
There are 4 main menus.- System - This menu contains functions proper to the system.
- Shutdown
- Reboot
- Reboot on other partition
- Exit Shell
- Configuration - This menu allows you to make actual changes to the configuration. For example change the IP address or the timezone.
- Diagnostics - This menu allows you to run tests, check logs and traces, which can lead you to a solution. For example tools like traceroute and ping are available in this menu.
- Subsystems - This menu lists all the subsystems (services), for each one of them, if implemented, you can start, stop and restart them.
Configuration
In the configuration menu you will be able to :- Change password - It will change the password of the 'admin' user, the one you use to access the Shell.
- Change the timezone and the keyboard layout - For each one of them a wizard will guide you select the correct configuration.
- Set up you network configuration
- Manually - This option will bring up a window were you are able to change your IP address, the Netmask, default gateway and the DNS servers.
- Automatically, using DHCP - This option will try to get your IP address, the Netmask, default gateway and the DNS servers automatically from your DHCP server.
- Change SMP.
- Handle your authentication keys.
- Restore the original SSH Server configuration.
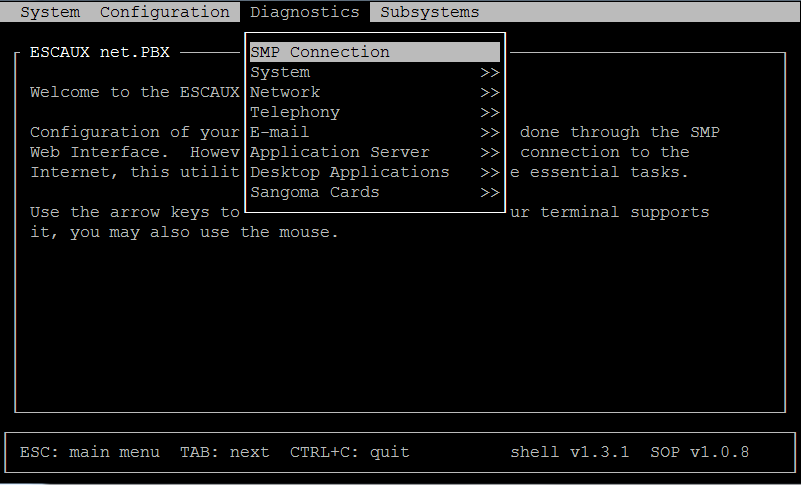
Diagnostics
In the diagnostics menu you will be able to use the following tools :- SMP Connection - Allows you to check all the parameters needed to obtain a connection from the SOP to the SMP.
- System
- Information
- List of correctly installed escaux packages
- CPU/Memory usage (top)
- Disk usage
- View the system log (/var/log/messages)
- View driver messages (dmesg)
- Network
- Ping - Insert a host name or a IP address in the displayed field then click on OK, a ping will be done to the specified host.
- Traceroute - Insert a host name or a IP address in the displayed field then click on OK, a traceroute will be done to the specified host.
- Status of ethernet connection
- Routing table - Displays the routing table
- ARP table - Displays the ARP table
- Sockets - Displays network connections (both incoming and outgoing)
- Capture traffic by host - Here you can capture the network traffic, view it real-time on the screen, or save it to a file (you are able to retrieve this file using the file manager), so that you can analyze the traffic using a tool like wireshark. When the "write on file manager" option is used, a binary file "tethereal.pcap" will be written on disk, in the "network_captures" directory, no matter the mode chosen. If "write on disk" is set to "no" and if the "complete" mode is used, the details of the packets received will be printed to screen. With the "brief" mode, only the summary of the packet will be printed to screen.
- Start Capture Traffic, same as above but you can use your own capture filters, and save the capture to a specific file. You can also make a background capture that will run even if you close the terminal. The files will be available on the file manager in the network_captures directory. When typing the file's name, please do not enter an extension, a "pcap" extension will be added. Note that the default filename for the capture file is "tethereal", it will be used if no filename is provided for both the "foreground + write to file" and the "background" mode. In both cases, the capture file will be available in the file manager.
- Stop Capture Traffic - Stops all running captures.
- View Capture Traffic - Displays the content of a capture file. When typing the file's name, please do not enter an extension, a "pcap" extension will be added.
- Telephony
- Set debug level of asterisk
- View the asterisk log
- View Asterisk Call Data Records
- Capture SIP traffic
- Capture TFTP traffic
- Display the asterisk console
- Debug asterisk startup - shows the asterisk console log.
- PCI cards - lists all the recognizes PCI cards.
- Email
- Send a test email - Allows you to check if emails are sent correctly.
- Show mail queue - Allows you to check the unsent mails.
- Run mail queue - Sends all the unsent mails.
Menus for customer user
There are 2 main menus.- System - This menu contains functions proper to the system.
- Shutdown
- Reboot
- Reboot on other partition
- Diagnostics - This menu allows you to run tests, check logs and traces, which can lead you to a solution. For example tools like traceroute and ping are available in this menu.
Diagnostics
In the diagnostics menu you will be able to use the following tools :- SMP Connection - Allows you to check all the parameters needed to obtain a connection from the SOP to the SMP.
- System
- Information
- List of correctly installed escaux packages
- CPU/Memory usage (top)
- Disk usage
- Network
- Ping - Insert a host name or a IP address in the displayed field then click on OK, a ping will be done to the specified host.
- Traceroute - Insert a host name or a IP address in the displayed field then click on OK, a traceroute will be done to the specified host.
- Status of ethernet connection
- Interface configuration
- Routing table - Displays the routing table
- ARP table - Displays the ARP table
- Sockets - Displays network connections (both incoming and outgoing)
- Capture traffic by host - Here you can capture the network traffic, view it real-time on the screen, or save it to a file (you are able to retrieve this file using the file manager), so that you can analyze the traffic using a tool like wireshark.
- View Capture Traffic - Displays the content of the latest capture file.
- Telephony
- Show SIP Peers
- Capture SIP traffic
- Capture TFTP traffic
- PCI cards - lists all the recognizes PCI cards.
- Email
- Send a test email - Allows you to check if emails are sent correctly.
- Show mail queue - Allows you to check the unsent mails.
- Run mail queue - Sends all the unsent mails.
Upgrading to versions >= 1.23.0 or >= 2.1.0 (for the 2.x branch)
When upgrading to a version >= 1.23.0 or >= 2.1.0, you need to make sure that you also upgrade the versions of the modules that these versions break. In that case, take the following steps:- Correctly set the version of each module that needs to be upgraded, including the Shell module.
- Set these modules to "install".
- Install modules.
- The result will be a number of errors. This is normal.
- Install modules again.
- There should no longer be the same errors
Copyright © Escaux SA