ESCAUX net.Supervisor 1.4.0 / 1.5.0 / 1.6.0 User Guide
Scope of this document
The purpose of this document is to allow the end user to discover the main features of the net.Supervisor application . This document describes how the application can be used and configured.Introduction
Escaux net.Supervisor is an application providing near-realtime monitoring of a Escaux UCS system used in a callcenter. The net.Supervisor dashboard can be watched on a PC or on a projector screen. It provides configurable, near real-time statistics on calls that are processed, calls which are in queue at any give time, how many agents are online, length of waiting queue and conversation and many others. All this is done by keeping some data in memory on the client machine running the net.Supervisor application. This way it ensures a minimal load and impact on the Escaux UCS. Initially, some historical data can optionally be retrieved by the end user. Based on the data in memory the net.Supervisor accumulates data and values from up to 48 hours, interdependently of what is being displayed. Hence, as an example, when a user increases the period over which the average conversation time for a call is calculated from 2hours to 24hours, no new data will need to be retrieved from the Escaux UCS. Calculating and visualizing statistics based on data sets older than 48 hours, is not in the scope of the net.Supervisor application. For this purpose, the Advanced Reporting functionality from the SMP is to be used.Detailed usage
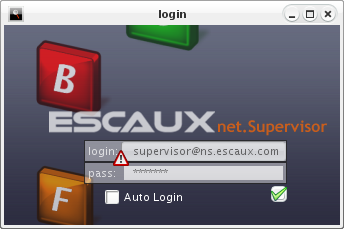
Login window
When the net.Supervisor client starts, the first thing you will see is the login screen. Simply enter your login and password and press ENTER. If you wish to auto-login the next time you log in, simply select the 'Auto login' check box. Note that a user will need to be granted permission to the net.Supervisor application, or a special login with this permission for net.Supervisor should be created in the Escaux UCS administration.
Login screen
Failed login
History selection window
After logging in, a dialog is displayed in which the user can select the initial history of events to fetch. Several durations are selectable, ranging from no history over 30 minutes to 2 days of history. The more data needs to be retrieved from the Escaux UCS, the longer it will take to obtain the results. Also note that on heavy loaded Escaux UCS systems fetching a lot of historical data can potentially temporarily impact the Escaux UCS. The amount of data you select will not matter for the amount of data the net.Supervisor will keep in memory. The amount of data to keep in memory will always be 48 hours, but when you initially select 'no history', it will take up to 48 hours before the accumulate data will be present in the net.Supervisor application. As a guideline, select here the amount of data that you want your initial statistics to be based upon. If you start net.Supervisor in the beginning of the day, when the callcenter start working, you could select 'no history' to get statistics during the day. If the application is launched in the middle of the day (say 3pm) while the callcenter is operational since 9am, then 6h would be a good initial fetch to cover the history since the beginning of the day.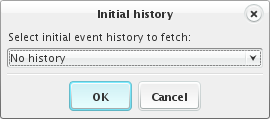
Selecting initial event history
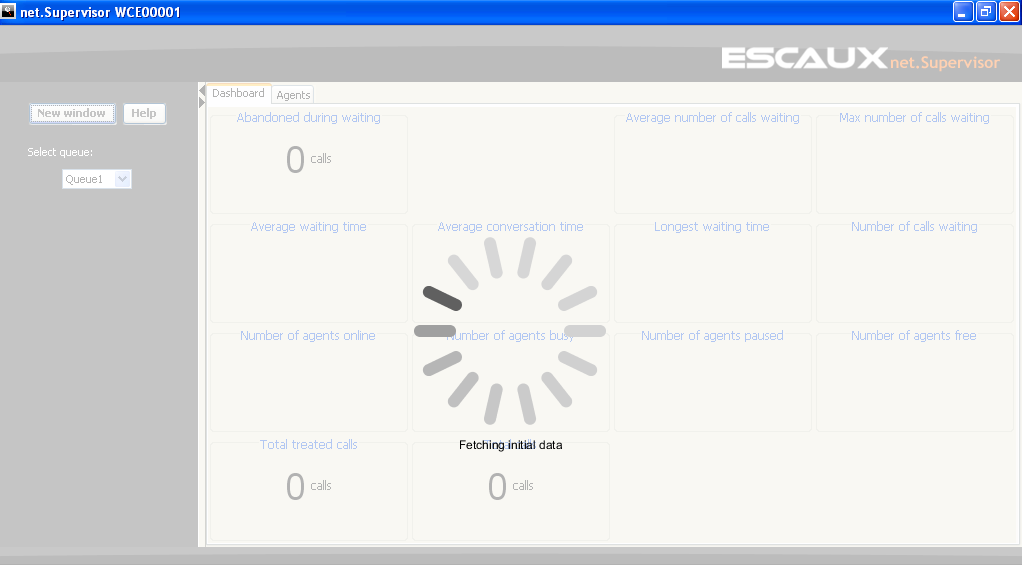
Fetching initial data
Main window
The main window consists of 2 areas.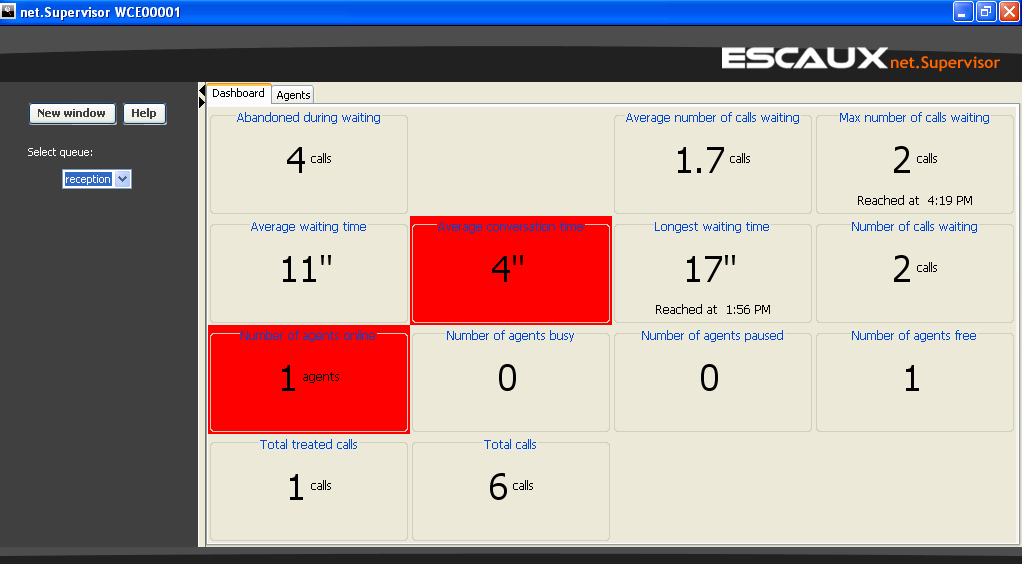
Main window
Left panel
On the left side is a queue selection pull down menu. Here you can select the queue which statistics you would like to see displayed in the dashboard on the right, or whose agents you would to look at.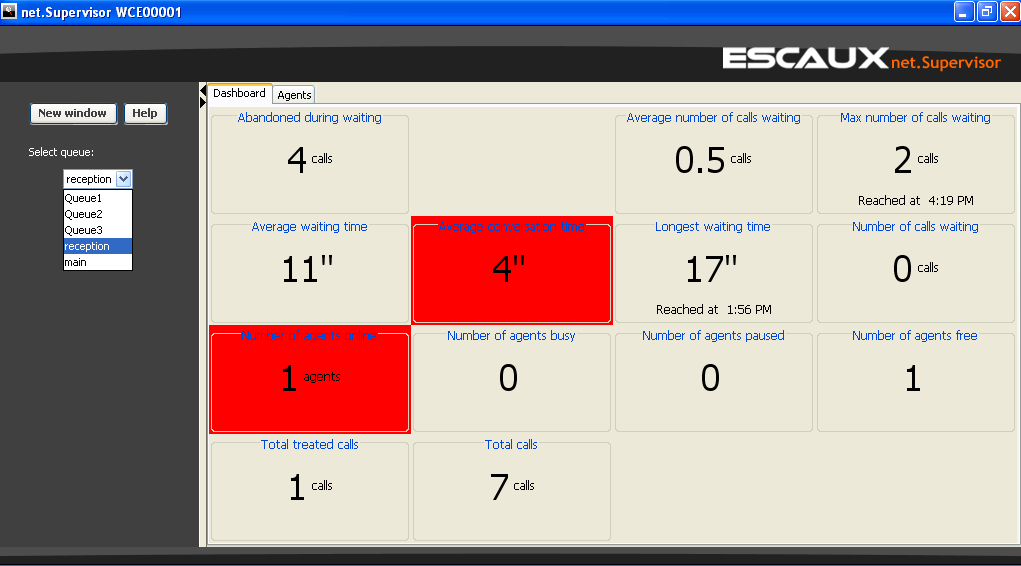
Queue selection window
Right panel
The right panel has two tabbed panels where you can either view the statistics for the selected queue, or see what the status of the agents working for the queue is.Dashboard
In the first tab you see the dashboard. The dashboard consists of 16 cells in 4x4 grid layout. Each cell can contain a user definable statistic, or be left empty. Initially some default statistics are displayed. Every non-empty cell has a title and a value. To see what exactly is displayed in a non-empty cell, hover your mouse over the value of the cell (only in maximized window). A tooltip popup window will show you what value is displayed and how it is calculated. More on how to interprete this in the following section.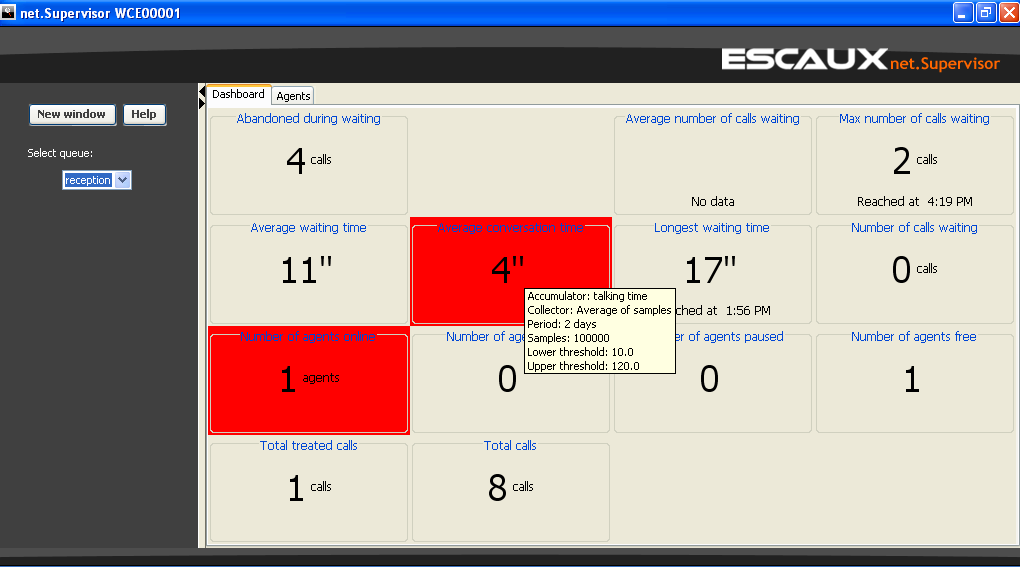
Statistic tooltip for a cell
Configuring dashboard cells
Left-click anywhere in the cell to bring up the cell configuration window. Here you can select what is displayed in a cell.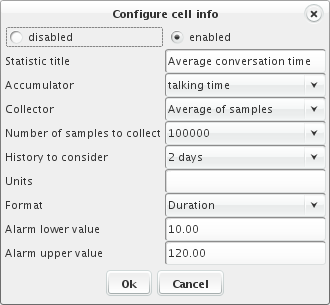
Configuring cell statistics and info
- Enabled/Disabled: selects whether anything should be displayed in this cell.
- Statistic title: Title to be displayed in the cell
- Accumulator: The accumulator whose values the statistic will be based upon (see below)
- Collector: How the statistic, based upon the accumulator values, should be calculated (see below)
- Number of samples to collect: the maximum number of values from the accumulator to consider
- History to consider: the maximum period in time to go back when considering values from the accumulator
- Units: the text to be displayed in the cell next to the calculated value
- Format: how the calculated value should be formatted. As a duration, an integer or a decimal value with 1 or 2 decimals.
- Alarm lower value: If the calculated value is less than this value, the cell will color red.
- Alarm upper value: If the calculated value is more than this value, the cell will color red.
Accumulators
An accumulator is a set of data, upon which a statistic is displayed. There are several accumulators defined that assemble data samples as events from the Escaux UCS come in. We will discuss them here.- calls waiting: This accumulator gets a value every time a call is queued. The value is equal to the number of calls currently in the queue. Useful aggregation could be looking at the last value to see how many calls are currently waiting in the queue, or an average in time to see how many calls are waiting on average.
- timed out: This accumulator get a zero value every time a call times out and is not re queued. The only useful statistic is to count the number of samples to get a view on the total calls that time out in the queue.
- abandon time: This accumulator gets a value every time a call is abandoned by the caller. Abandoned can only occur before the call was answered by an agent. The value is equal to the total time in seconds that the user has been on the waiting queue, or all the sum of all waiting queues the call has been on in the case there were multiple queues. In this case, the sample will only be added to the abandon time accumulator of the queue the call was in when the user abandoned the call. Useful aggregations here are counting the number of values to get the total amount of calls abandoned, or averaging the values to get a statistic on the average time which passes before a user abandons.
- waiting time: This accumulator gets a value every time a call is answered by an agent. The value will be equal to the time in seconds since the call entered the first queue. Useful aggregation could be an average of samples, to get the average waiting time for callers, or maximum or minimum to get a view on the peaks. Counting the samples provides the number of answered calls by all agents in this queue.
- talking time: This accumulator samples the total conversation time between an agent and a caller. This value can also be averaged, or peaked (max/min).
- treated calls : This accumulator is incremented every time a call has been taken by one of the agents. It counts the number of calls that have been treated by agents.
- total calls: This accumulator is incremented every time a call is completed. This can be either when it is really completed (by either the agent or the caller), or when it is abandoned or when it times out in a queue and it is not re queued. The only useful statistic is to count the number of samples to get a view on the total calls that arrive in the call center, both processed and unprocessed
- agents free: This accumulator gets a value equaling the agents free for calls whenever an agent logs in, out, pauses, or starts or stops handling a call. Useful statistic is to look at the last value to see the current number of agents free, or to get an average in time of how many agents were free on average over a time period.
- agents busy: This accumulator gets a value equaling the agents that are busy with calls whenever an agent logs in, out, pauses, or starts or stops handling a call. Useful statistic is to look at the last value to see the current number of agents busy, or to get an average in time of how many agents were busy on average over a time period.
- agents logged in: This accumulator gets a value equaling the agents that are logged in with calls whenever an agent logs in, out, pauses, or starts or stops handling a call. Useful statistic is to look at the last value to see the current number of agents logged in, or to get an average in time of how many agents were logged in on average over a time period.
- agents paused: This accumulator gets a value equaling the agents that are paused with calls whenever an agent logs in, out, pauses, or starts or stops handling a call. Useful statistic is to look at the last value to see the current number of agents paused, or to get an average in time of how many agents were paused on average over a time period.
- timed out: This accumulator counts the calls that are neither answered, nor abandoned during waiting.
Collectors
The collector specifies how the cell data should be calculated based upon the accumulator. Collectors will only consider those values that are not older than the age specified in the statistic configuration, and will limit itself to the maximum amount of samples that are specified there. If more samples are available only the last set of samples will be used.- Counter: Counts the number of values in the accumulator.
- Maximum: Finds the largest value in the accumulator.
- Minimum: Finds the smallest value in the accumulator.
- Last value: Takes the last value in the accumulator
- First value: Takes the find value in the accumulator, taking the maximum history and maximum samples to consider into account
- Average of samples: calculates the average value of all the values in the accumulator.
- Average in time: calculates the integral over time of the values in the accumulator. The time period considered is the history to consider from the cell configuration.
10 seconds later call 2 enters queue 1. Calls waiting samples 2.
Again 10 seconds later call 1 is picked up by an agent. Calls waiting samples 1.
Again 10 seconds later call 2 is picked up by an agent. Calls waiting samples 0.
Suppose we select history to consider as 1 minute and we watch the statistic 30 seconds later.
If the statistic was based upon 'Average of samples', the value would be 1+2+1+0/4 = 1.
If the statistic was based upon 'Average in time', the value would be (1*10+2*10+1*10+0*30)/60=0,67 and would be decreasing every second, until a new value comes in, or the value reaches zero.
As a rule of thumb, you are most likely interested in average of samples of talking time, waiting time, abandon time, and a timed based average of the other accumulators.
Alarm values
A statistic presentation can color red if the values are outside the boundaries configured in the cell configuration. These values are decimal numbers against which the calculated value is compared. In the case of a duration, the values are expressed in seconds.- alarm on : calculated value < lower limit or calculated value >= upper limit
- alarm off: lower limit <= calculated value < upper limit
Statistics in alarm mode
Agents
In the agents tab an overview of all the agents for the selected queue is displayed. The window will show for each of the registered agents the extension, the id of their phone and the current status. This status can be either free, busy, ringing, unavailable or invalid. Columns can be sorted by clicking on the column header. To reverse the sorting, click again. You can force an update of the list by clicking on the refresh button.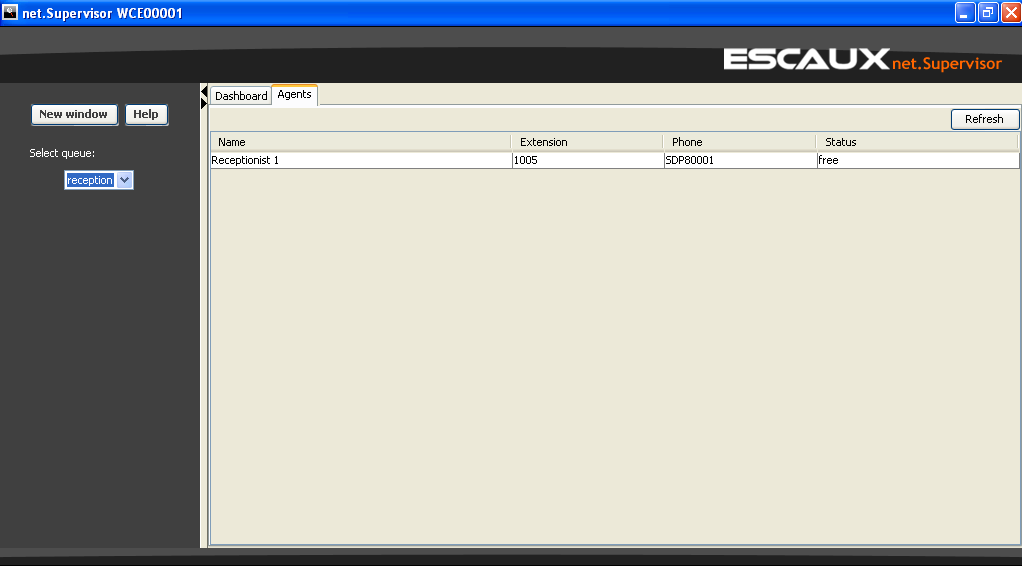
Agents overview
Copyright © Escaux SA