Service Assurance: Sangoma Card Support v.2
- Service Assurance: Sangoma Card Support v.2
- History
- Working principle
- HowTo
- How to check physical card installation?
- How to check driver status?
- How to check gateway status ?
- Alarms for PRI cards
- FXS Cards voltage information
- How to take BRI/PRI traces ?
- Advanced topics (Escaux only)
- How to check the Sangoma post-sync task (Escaux only)
- How to access the NetBorder Web interface? (Escaux only)
- How to downgrade from Sangoma Card Support 2.0.0 to Sangoma Card Support 1? (Escaux only)
- How to use command line OAM provided with NetBorder? (Escaux only)
- How to configure manually NetBorder? (Escaux only)
- How to check the PRI status? (Escaux only)
- How to check the drivers error statistics? (Escaux only)
- How to check the HW echo canneler is active
- How to deactivate the HW echo canneler
- How to check the status of the echo canceller? (Escaux only)
- How to analyze dropping BRI D-Channel
- How to check if there are overruns and how to analyse them? (Escaux only)
- How to Disable the CPU system load monitor of Sangoma
- Other resources
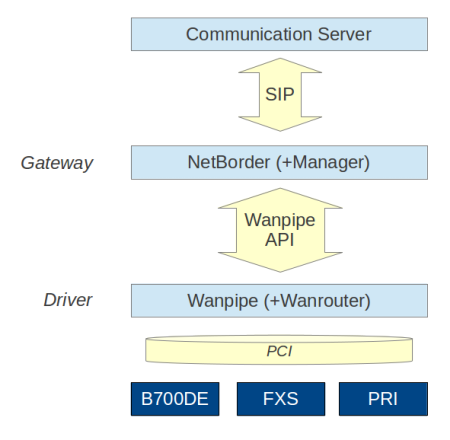
Working principle
Sangoma architecture is composed of 3 stacks:- The hardware stack: B700DE (BRI/FXS), A10X (PRI), A200 (FXS)
- The driver stack: Wanpipe. Wanrouter is the driver rmanagement tool
- The gateway stack: NetBorder.
HowTo
How to check physical card installation?
Card and modules installation check
-----------------------------------------
| Wanpipe Hardware Probe Info (verbose) |
-----------------------------------------
1 . AFT-A104-SH : SLOT=4 : BUS=8 : IRQ=16 : CPU=A : PORT=1 : HWEC=128 : V=43
+01:DS26524: PCIe: PLX2
2 . AFT-A104-SH : SLOT=4 : BUS=8 : IRQ=16 : CPU=A : PORT=2 : HWEC=128 : V=43
+02:DS26524: PCIe: PLX2
3 . AFT-A104-SH : SLOT=4 : BUS=8 : IRQ=16 : CPU=A : PORT=3 : HWEC=128 : V=43
+03:DS26524: PCIe: PLX2
4 . AFT-A104-SH : SLOT=4 : BUS=8 : IRQ=16 : CPU=A : PORT=4 : HWEC=128 : V=43
+04:DS26524: PCIe: PLX2

Sangoma Card Count: A104=1
Card module missing
If the modules are not well inserted, you'll see a specific message in the system log.wanpipe1: Error, A500/B700 card not found on bus #5, slot #4, cpu A, line 1
Card and cable installation check
- If you use a FXS card ( A200 ) in combination with one PRI ( A100 ) or BRI ( B700 ). You need a sync cable between both
- Remember that BRI ( B700 ) and FXS card ( A200 ) need external power ( add a power cable )
Molex missing for FXS cards
FXS cards and hybrid cards need a molex to be connected (for extra power). If the molex is unplugged Asterisk will not start and you'll see a specific message in the system log.wanpipe3: Starting WAN Setup Processing WAN device wanpipe3... wanpipe3: Locating: A200/A400/B600/B700 card, CPU A, PciBus=5, PciSlot=4 wanpipe3: Found: A500/B700 card, CPU A, PciBus=5, PciSlot=4, Port=4 wanpipe3: Starting AFT Analog Hardware Init. wanpipe3: Enabling front end link monitor wanpipe3: Global Chip Configuration: used=3 used_type=1 wanpipe3: Global Front End Configuration! wanpipe3: Configuring FXS/FXO Front End ... wanpipe3: Module 1: Failed to powerup within 600 ms (0V : 72V)! wanpipe3: Module 1: Did you remember to plug in the power cable? wanpipe3: Module 1: Unable to do INITIAL ProSLIC powerup! wanpipe3: Module 1: Retry configuration... wanpipe3: Module 1: Failed to powerup within 600 ms (0V : 72V)! wanpipe3: Module 1: Did you remember to plug in the power cable? wanpipe3: Module 1: Unable to do INITIAL ProSLIC powerup! wanpipe3: Module 1: FXS failed! wanpipe3: Module 2: Failed to powerup within 600 ms (0V : 72V)! wanpipe3: Module 2: Did you remember to plug in the power cable? wanpipe3: Module 2: Unable to do INITIAL ProSLIC powerup! wanpipe3: Module 2: Retry configuration... wanpipe3: Module 2: Failed to powerup within 600 ms (0V : 72V)! wanpipe3: Module 2: Did you remember to plug in the power cable? wanpipe3: Module 2: Unable to do INITIAL ProSLIC powerup! wanpipe3: Module 2: FXS failed! wanpipe3: 2 FXO/FXS module(s) are failed to initialize! wanpipe3: Failed Front End configuration! wanpipe3: TASKQ Not Running wanpipe3: AFT communications disabled! (Dev Cnt: 1 Cause: Device Down) wanpipe3: AFT communications disabled! (Dev Cnt: 1 Cause: Device Down) wanpipe3: Global Chip Shutdown Usage=3, Used_type_cnt=1 wanpipe3: Master shutting down
How to check driver status?
Devices currently active:
   wanpipe1 wanpipe2 wanpipe3 wanpipe4


Wanpipe Config:

Device name | Protocol Map | Adapter  | IRQ | Slot/IO | If's | CLK | Baud rate |
wanpipe1    | N/A          | A101/1D/A102/2D/4/4D/8| 16  | 4       | 1    | N/A | 0         |
wanpipe2    | N/A          | A101/1D/A102/2D/4/4D/8| 16  | 4       | 1    | N/A | 0         |
wanpipe3    | N/A          | A101/1D/A102/2D/4/4D/8| 16  | 4       | 1    | N/A | 0         |
wanpipe4    | N/A          | A101/1D/A102/2D/4/4D/8| 16  | 4       | 1    | N/A | 0         |

Wanrouter Status:

Device name | Protocol | Station | Status        |
wanpipe1    | AFT TE1  | N/A     | Connected     |
wanpipe2    | AFT TE1  | N/A     | Connected     |
wanpipe3    | AFT TE1  | N/A     | Disconnected  |
wanpipe4    | AFT TE1  | N/A     | Disconnected  |
If the driver does not load correctly or your cards are not recognized, you can have a look in the system debug log.
How to check gateway status ?
service netborder-gateway is running
CPU Usage: 1.6 %, Memory Usage: 21756 KB, Uptime: 109-22:50:16
service netborder-gateway-manager is running
CPU Usage: 0.1 %, Memory Usage: 12592 KB, Uptime: 109-14:47:53
- It's important to see at least netborder-gateway is running
Jun 24 17:30:49 00001107 netborder: 2013-06-24 17:30:49:051 [15834:15834] INFO - admin : Netborder Express Gateway version 4.3.10
Jun 24 17:30:49 00001107 netborder: 2013-06-24 17:30:49:051 [15834:15834] INFO - netborder.infra.Application : Build : maint/nbe-4.3:21927?
Jun 24 17:30:49 00001107 /usr/bin/crontab[15839]: (root) LIST (root)
Jun 24 17:30:49 00001107 /usr/bin/crontab[15844]: (root) REPLACE (root)
Jun 24 17:30:49 00001107 netborder: 2013-06-24 17:30:49:327 [15834:15834] ERROR - netborder.xml : I/O warning : failed to load external entity "/opt/Netborder/Express/Gateway/config/pstn
-config.xml"
Jun 24 17:30:49 00001107 netborder: 2013-06-24 17:30:49:327 [15834:15834] ERROR - netborder.pstn.config.XmlConfig : failed to parse XML file /opt/Netborder/Express/Gateway/config/pstn-co
nfig.xml
Jun 24 17:30:49 00001107 netborder: 2013-06-24 17:30:49:329 [15834:15834] ERROR - netborder.media.hostmedia.ToneBankManager : Can't load Pstn Config.
Jun 24 17:30:49 00001107 netborder: 2013-06-24 17:30:49:329 [15834:15834] ERROR - netborder.media.rtp.JRtpMediaEngine : failed to initialize tone bank manager
Jun 24 17:30:49 00001107 netborder: 2013-06-24 17:30:49:339 [15834:15834] ERROR - netborder.infra.DynlibObjectFactory : Error calling creation method "LoadMethod"
Jun 24 17:30:49 00001107 netborder: 2013-06-24 17:30:49:339 [15834:15834] ERROR - netborder.voip.DsVoipGatewayNetIf : Failed to get SIP Media Engine from library netborder-JRtpMediaEngin
e
Jun 24 17:30:49 00001107 netborder: 2013-06-24 17:30:49:339 [15834:15834] ERROR - netborder.voip.DsVoipGatewayNetIf : failed to configure sip network interface
Jun 24 17:30:49 00001107 netborder: 2013-06-24 17:30:49:347 [15834:15834] ERROR - netborder.infra.DynlibObjectFactory : Error calling creation method "LoadMethod"
Jun 24 17:30:49 00001107 netborder: 2013-06-24 17:30:49:348 [15834:15834] ERROR - netborder.infra.Application : failed to load the VoIP library
If you have that error, check your configuration ( don't forget the FXS resources ) and make a new Apply-changes without cache.
Alarms for PRI cards
Starting from Sangoma module 2.5, you can check the alarms for your PRI cards using the SOP Shell.***** w6g1: E1 Rx Alarms (Framer) ***** ALOS: OFF | LOS: ON RED: ON | AIS: OFF LOF: ON | RAI: OFF ***** w6g1: E1 Rx Alarms (LIU) ***** Short Circuit: OFF Open Circuit: ON Loss of Signal: ON ***** w6g1: E1 Tx Alarms ***** AIS: OFF | YEL: ON ***** w6g1: E1 Performance Monitoring Counters ***** Line Code Violation : 0 Far End Block Errors : 0 CRC4 Errors : 0 FAS Errors : 0 Sync Errors : 0 Rx Level : -10db to -12.5dbAs noticed, the alarms are split in 3 different categories: ->Rx Framer alarms ->Rx (LIU) alarms ->Performance Monitoring Counters Below is a description of each Alarm: https://wiki.freepbx.org/pages/viewpage.action?pageId=57411508
FXS Cards voltage information
Starting from Sangoma module 2.5, you can check the Voltage Status of your FXS cards via the SOP Shell.FXS card: w5g1 ------- Voltage Status (FXS,port 0) ------- TIP : - 6.0160 Volts RING : -53.3920 Volts VBAT : -62.4160 Volts
How to take BRI/PRI traces ?
Advanced topics (Escaux only)
How to check the Sangoma post-sync task (Escaux only)
Look at/var/log/sangoma_postsync.log
Example output for a 1PRI card.
############################ Starting log ###################################
Could not open file fxsInterface
Could not open file briInterfaceCould not open file priInterface
Could not open file channelGroups
Could not open file isdn
Could not open file analog
There are 0 fxs interfaces in the board.
There are 0 bri interfaces in the board.
There are 1 pri interfaces in the board.
Ignoring fxs configuration because there are none configured.
Ignoring bri configuration because there are none configured.
Ignoring pri configuration because there are none configured.
Constructing the config file.
there are 0 unused fxs interfaces
there are 0 used fxs interfaces
there are 0 unused bri interfaces
there are 0 used bri interfaces
there are 1 unused pri interfaces
there are 0 used pri interfaces
error while validating : unknown-8488200:0: Relax-NG validity error : Expecting an element , got nothing
unknown-8488200:0: Relax-NG validity error : Expecting an element , got nothing
unknown-8488200:0: Relax-NG validity error : Expecting an element , got nothing
How to access the NetBorder Web interface? (Escaux only)
- Go to
http://<sop_ip>:7783
How to downgrade from Sangoma Card Support 2.0.0 to Sangoma Card Support 1? (Escaux only)
/etc/init.d/netborder-gateway stop
/etc/init.d/netborder-gateway-manager stop

rpm -q netborder-gateway
root@00000004:/usr/sbin# /etc/init.d/netborder-gateway stop
Stopping netborder-gateway
CPU Usage: 1.9 %, Memory Usage: 59856KB, Uptime: 29:00
[SUCCESS]

root@00000004:/usr/sbin# /etc/init.d/netborder-gateway-manager stop
Stopping netborder-gateway-manager
CPU Usage: 0.3 %, Memory Usage: 47108KB, Uptime: 56:08
[SUCCESS]

root@00000004:/usr/sbin# rpm -q netborder-gateway
netborder-gateway-4.2.1-1.i386
root@00000004:/usr/sbin# rpm -e --force-debian netborder-gateway
/opt/Netborder/Express/Gateway/linux/pre-uninstall.sh: 7: XXX_PREFIX_XXX/linux/uninstall-gateway-manager-service.sh: not found
/opt/Netborder/Express/Gateway/linux/pre-uninstall.sh: 8: XXX_PREFIX_XXX/linux/uninstall-gateway-service.sh: not found

Interfaces to shutdown:
w5g1
w4g1
w3g1
w2g1

/opt/Netborder/Express/Gateway/drivers/wanpipe /
        ----------------------------------------------------------
                  WANPIPE v3.5.25 Installation Script
            Copyright (c) 1995-2011, Sangoma Technologies Inc.
        ----------------------------------------------------------

You are about to uninstall WANPIPE package!

Are you sure? (y/n) Error: Wanpipe appears to be running. Stop it first!
Uninstalling WANPIPE Binaries!\n
Press [Enter] to continue.../
root@00000004:/usr/sbin#
Reboot the SOP in order to get rid of wanpipe
How to use command line OAM provided with NetBorder? (Escaux only)
root@00000096:~# cd /opt/Netborder/Express/Gateway/bin/
root@00000096:/opt/Netborder/Express/Gateway/bin# export LD_LIBRARY_PATH=/opt/Netborder/Express/Gateway/lib:LD_LIBRARY_PATH
root@00000096:/opt/Netborder/Express/Gateway/bin# ./netborder-oam-cmd localhost:18086 help
INFO - Contacting localhost:18086
INFO - Command not supported. Supported commands :
dump-core
get-alarms
get-all-alarms
get-call-logger-status
get-config-param
get-log-level
get-mem-account-info
get-om
get-run-mode
parse-routingrules
pstn-channel-op
pstn-span-op
reset-alarm-state
set-call-logger-status
set-config-param
set-log-level
set-run-mode
validate-routingrules
root@00000096:/opt/Netborder/Express/Gateway/bin#
How to configure manually NetBorder? (Escaux only)
If NetBorder does not start but wanpipe is started, a 'Quick Setup' is possible via the Web Interface:- BRI interfaces must be renamed: BRI1, BRI2...
- FXS interfaces must be renamed: FXS1, FXS2...
- extension and group must be 101 for FXS1, 102 for FXS2...
- In the Sangoma Card Configuration available from the Administration Guide, check the detailed configuration settings
How to check the PRI status? (Escaux only)
http://wiki.sangoma.com/wanpipemon-T1-E1-line-alarms-0How to check the drivers error statistics? (Escaux only)
# wanpipemon -i w1g1 -c sc (5 times every 5 sec)
root@00000010:~# wanpipemon -i w1g1 -c sc


        ------------------------------------------------------
                w1g1: AFT COMMUNICATION ERROR STATISTICS
        ------------------------------------------------------

RX Stats:
                        Number of receiver overrun errors:  0
                            Number of receiver CRC errors:  0
                          Number of receiver Abort errors:  0
                     Number of receiver corruption errors:  0
                            Number of receiver PCI errors:  0
                 Number of receiver DMA descriptor errors:  0
TX Stats:
                         Number of transmitter PCI errors:  0
               Number of transmitter PCI latency warnings:  0
              Number of transmitter DMA descriptor errors:  0
       Number of transmitter DMA descriptor length errors:  0
# wanpipemon -i w1g1 -c sif (5 times every 5 sec)
root@00000010:~# wanpipemon -i w1g1 -c sif

******* OPERATIONAL_STATS *******
        rx_packets      : 2665855
        tx_packets      : 2665633
        rx_bytes        : 4206169408
        tx_bytes        : 4205103808
        rx_errors       : 0
        tx_errors       : 0
        rx_dropped      : 40
        tx_dropped      : 0
        multicast       : 0
        collisions      : 0
        rx_length_errors: 0
        rx_over_errors  : 0
        rx_crc_errors   : 0
        rx_frame_errors : 0
        rx_fifo_errors  : 0
        rx_missed_errors: 0
        rx_hdlc_abort_counter: 0
        tx_aborted_errors: 0
        Tx Idle Data    : 262
        tx_fifo_errors  : 0
        tx_heartbeat_errors: 0
        tx_window_errors: 0

        tx_packets_in_q: 3
        tx_queue_size: 32

        rx_packets_in_q: 0
        rx_queue_size: 10

        rx_events_in_q: 0
        rx_event_queue_size: 180
        rx_events: 120
        rx_events_dropped: 0
        HWEC tone (DTMF) events counter: 0
*********************************
        Driver Version: 3.5.25.4
        Firmware Version: 43
        CPLD Version: 0
How to check the HW echo canneler is active
Use the following command listed below. Change w1g1 if needed for your setuproot@00011901:~# wanpipemon -i w1g1 -c ehw Sangoma HW Echo Canceller is disabled for all channels!
How to deactivate the HW echo canneler
The following command will disable the HW echo canneler temporally :wan_ec_client wanpipe1 disable allIn order to do to this the correct way change it in file "/opt/Netborder/Express/Gateway/config/pstn-config.xml"
How to check the status of the echo canceller? (Escaux only)
root@00001593:~# wan_ec_client wanpipe1 stats


wanpipe1: Running Get stats command to Echo Canceller device... Done!

****** Echo Canceller Chip Get Stats wanpipe1 ******
  wanpipe1: Number of channels currently open                   8
  wanpipe1: Number of conference bridges currently open         0
  wanpipe1: Number of playout buffers currently loaded          0
  wanpipe1: Number of framing error on H.100 bus                1
  wanpipe1: Number of errors on H.100 clock CT_C8_A             1
  wanpipe1: Number of errors on H.100 frame CT_FRAME_A          0
  wanpipe1: Number of errors on H.100 clock CT_C8_B             0
  wanpipe1: Number of internal read timeout errors              0
  wanpipe1: Number of SDRAM refresh too late errors             0
  wanpipe1: Number of PLL jitter errors                         0
  wanpipe1: Number of HW tone event buffer has overflowed       0
  wanpipe1: Number of SW tone event buffer has overflowed       0
  wanpipe1: Number of SW Playout event buffer has overflowed    0
How to analyze dropping BRI D-Channel
When you are analyzing the BRI ISDN logs, if you see following error in /var/log/debug:smg_bri[16060]: (s1) DL report: D-channel down smg_bri[16060]: (s2) DL report: D-channel downTake a pcap trace to verify which side is dropping the D-Channel. The source that initiates SABME messages is the side that sees the D-Channel down and is asking the remote side to bring it up. Normally you should see a pcap containing only RR (receive ready) messages, but if the D-channel is down, you see that the Local User is sending a message Identity Request for the TEI. By default, the TEI is set to 0 when the connection type is set to point to point and 127 when the connection type is set to point to multipoint. If the SABME is initiated by the Remote Network, contact your operator to confirm which connection type is used and configure the correct connection type in the BRI interface on the SOP: point to point or point to multipoint. For a successful call, you see following behavior: In the pcap you see that the operator sends a SABME message. The SOP/Sangoma card should answer with an UA message to activate the layer 2. Once the layer 2 is activated, the PABX or the remote network can start sending every 10 secs RR messages which have to be acknowledged by RR messages.
How to check if there are overruns and how to analyse them? (Escaux only)
# Check for overruns in the drivers:
root@00000010:~# watch -n 5 "ifconfig w1g1"
Every 5.0s: ifconfig w1g1                               Thu May 24 11:22:08 2012

w1g1      Link encap:Point-to-Point Protocol
          UP POINTOPOINT RUNNING NOARP  MTU:4864  Metric:1
          RX packets:4686206 errors:0 dropped:0 overruns:0 frame:0
          TX packets:4686198 errors:0 dropped:0 overruns:0 carrier:2
          collisions:0 txqueuelen:100
          RX bytes:814841920 (814.8 MB)  TX bytes:814832320 (814.8 MB)
          Interrupt:16 Memory:f8a00000-f8a01fff
The overruns counter should not increase. This test must be repeated for each wXgY.
# Check for overruns and underruns or error message from the drivers in syslog:
root@00000010:# grep wanpipe /var/log/syslog# Check for overruns and underruns or error in netborder Via sopshell activate the netborder logging
root@00000010:# grep "ERROR" /var/log/messagesThe possible cause of the overrun can be:
- the load
root@00000010:# top
top - 13:37:24 up 3 days,  3:40,  1 user,  load average: 0.31, 0.37, 0.31
Tasks: 102 total,   1 running,  99 sleeping,   0 stopped,   2 zombie
Cpu(s):  0.5%us,  0.4%sy,  0.0%ni, 98.8%id,  0.2%wa,  0.0%hi,  0.0%si,  0.0%st
Mem:   2053236k total,   603008k used,  1450228k free,   232516k buffers
Swap:  3999992k total,        0k used,  3999992k free,   216676k cached

  PID USER      PR  NI  VIRT  RES  SHR S %CPU %MEM    TIME+  COMMAND
    1 root      20   0  2644 1584 1204 S    0  0.1   0:01.02 init
    2 root      20   0     0    0    0 S    0  0.0   0:00.00 kthreadd
    3 root      RT   0     0    0    0 S    0  0.0   0:00.06 migration/0
    4 root      20   0     0    0    0 S    0  0.0   0:00.50 ksoftirqd/0
    5 root      RT   0     0    0    0 S    0  0.0   0:00.00 watchdog/0
IO performance of the server
root@00000010:/opt/Netborder/Express/Gateway/logs# vmstat 1
procs -----------memory---------- ---swap-- -----io---- -system-- ----cpu----
 r  b   swpd   free   buff  cache   si   so    bi    bo   in   cs us sy id wa
 0  0      0 1450344 232544 216676    0    0     1     4    1   37  1  0 99  0
 0  0      0 1450336 232544 216700    0    0     0     0 1510  950  0  4 96  0
How to Disable the CPU system load monitor of Sangoma
Sangoma stops accepting calls when the system load is to high. You can deactivate this feature by doing this :root@00002110:/opt/Netborder/Express/Gateway/config# vim gw.properties netborder.system.cpu.monitor.monitoringPeriodInMs=0 Next restart your sangoma gateway using the shell
Other resources
Copyright © Escaux SA